


Sprint Metrics Report
Document Change Control
| Release No | Release Date | Issued By | Version Comment | ClickUp Version Time |
| 1.0 | 23/1/2025 | Ahmed Shehata | Initial Version | Mar 02 11:50 am |
| 2.0 | 30/9/2025 | Ahmed Shehata | Updating Metrics | Oct 07 2:32 pm |
List Of Approvers
| Name | Title | Approved Release No |
| Tarek Ramadan | Software Engineering Director | 2.0 |
Sprint Metrics Report
| Project Name | Enterprise architecture |
| Release No | Release 1 |
| Sprint No | Sprint 3 |
| Issue Date | 17/01/2025 |
| Issued By | Ahmed Essam |
| Reviewed By | Ahmed Shehata |
| Metric | Target | Snapshot | Actual Value | RCA | Comment(s) |
| Sprint Rework Rate | <=10% | 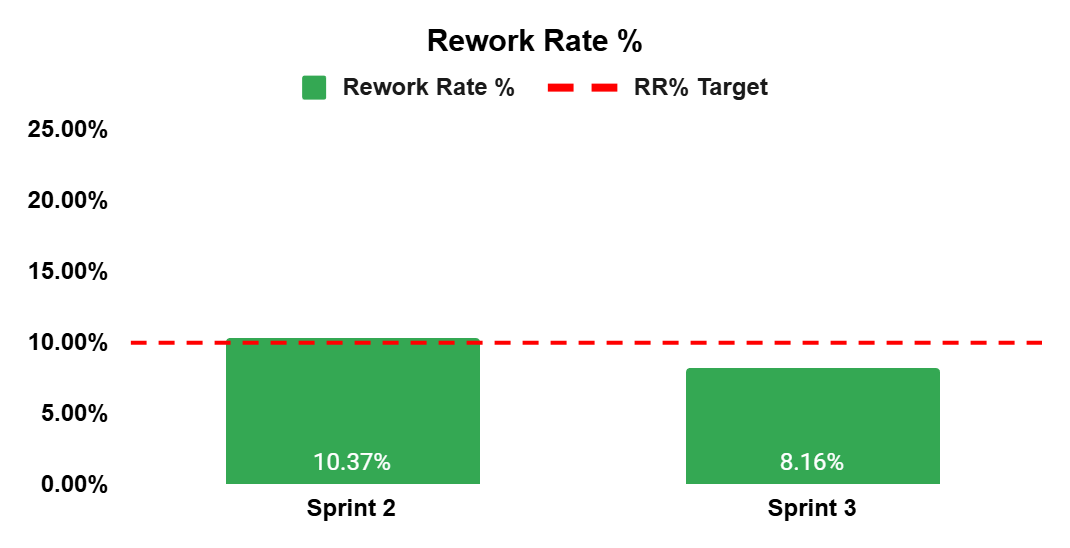 | 8% |
|
|
| Sprint Burn-down | >= 95% | 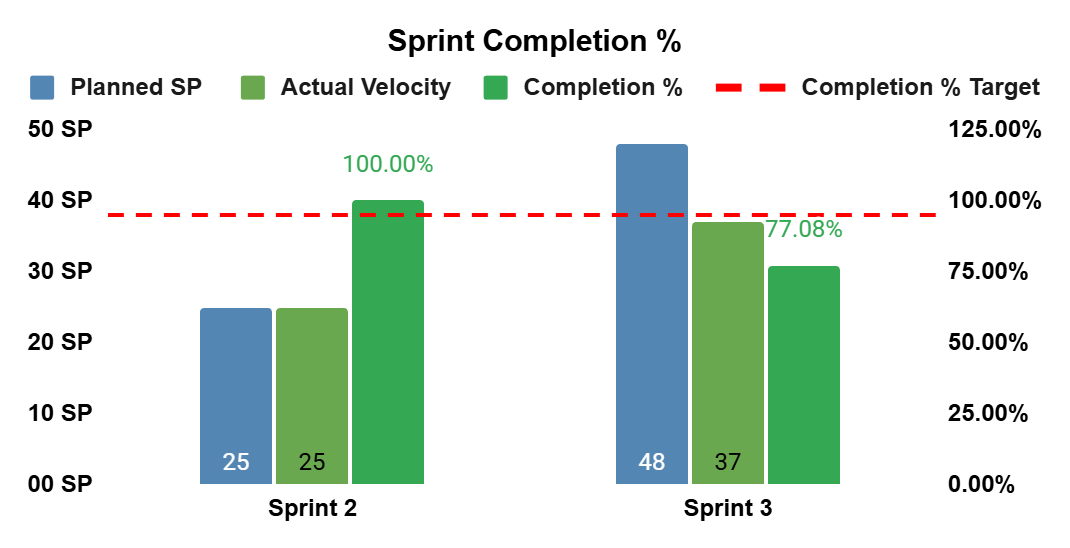 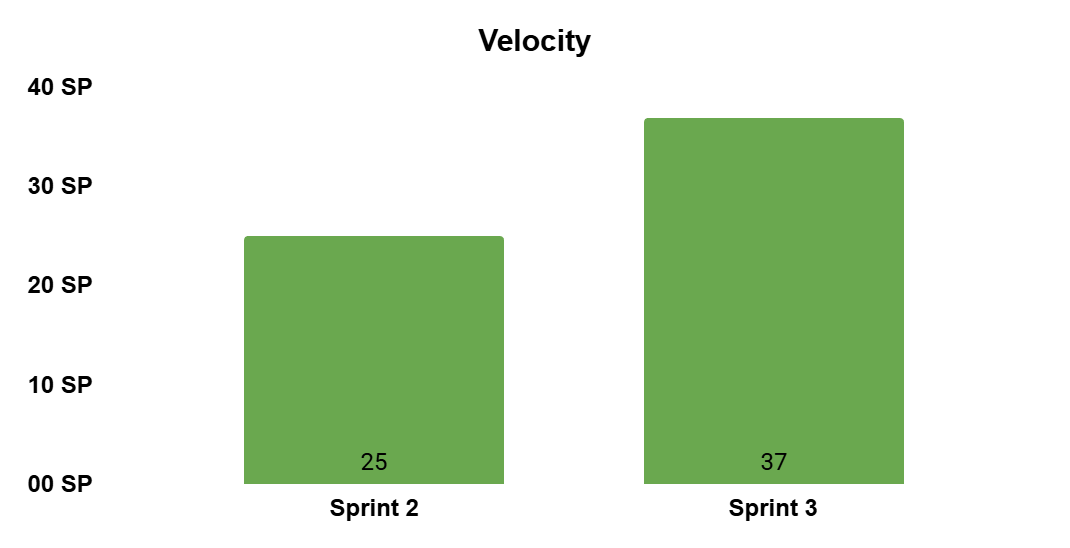 | 77% | The velocity of the team increased by 48% rather than sprint 2, but this increase was not shown in the completion rate because the team assigned story points more than its capacity and didn't remove them before the sprint closure date |
|
| Average Cycle Time of US per sprint | <= 5 | 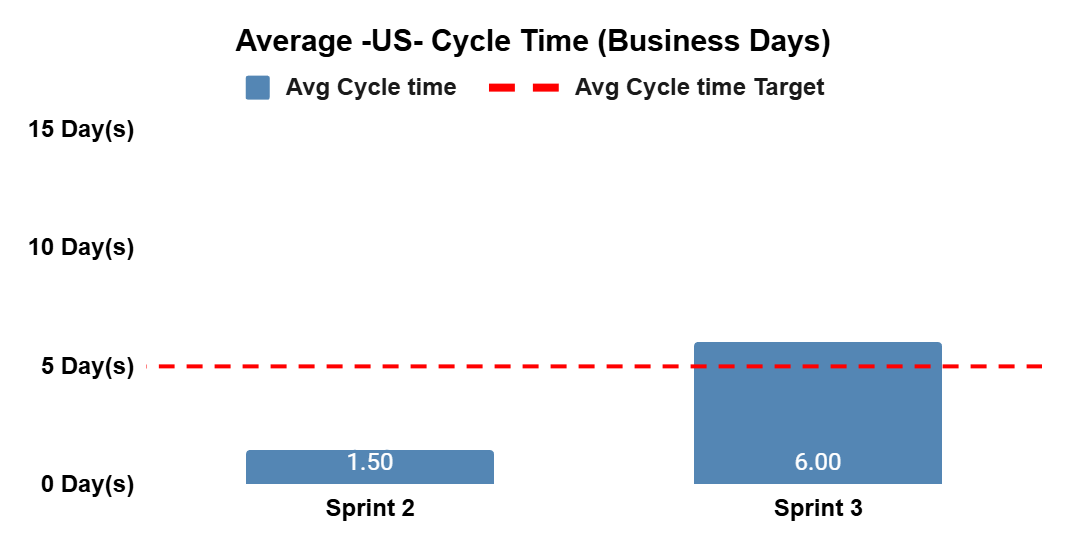 | 6 | the one resource take the contingency vacation and its stories affected on the cycle time ratio |
|
| Weighted Defect Density (WDD) | <= 2 | 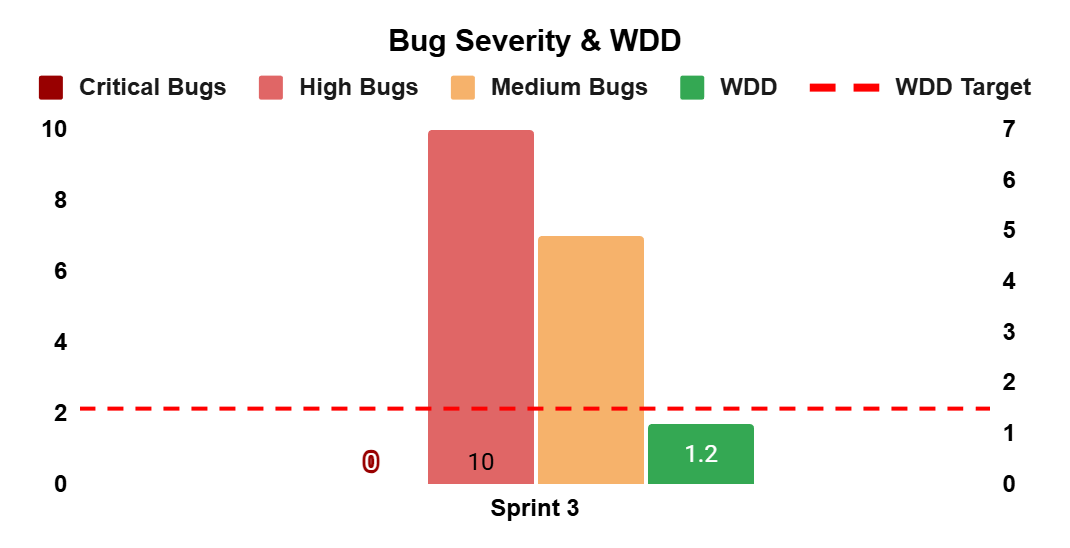 | 1.2 |
|
|
| Sprint Defect Removal Efficiency (DRE) | >= 85% | 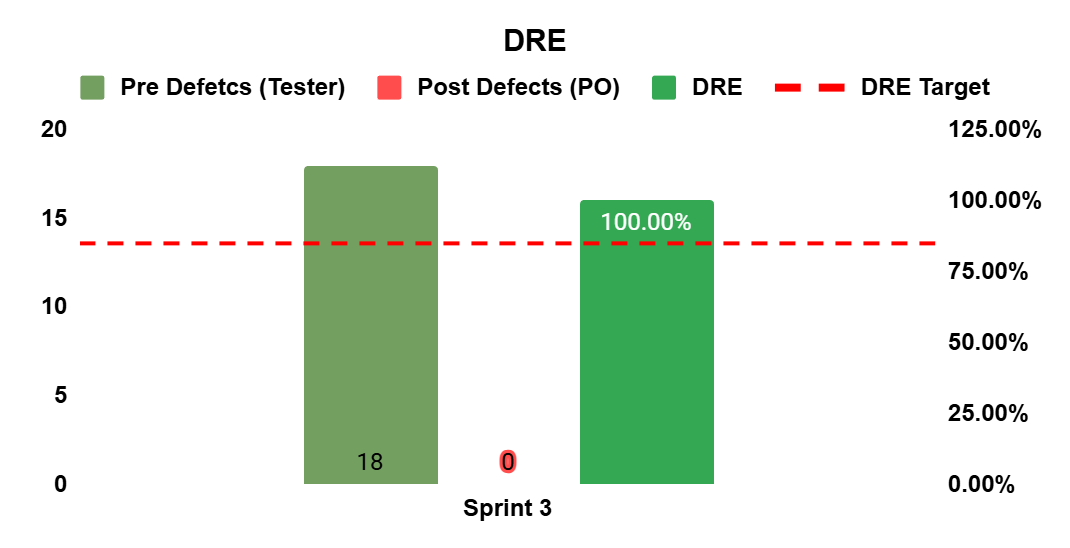 | 100% |
|
|
Recommendations & Actions after Sprint 3
The velocity of the team increased by 48% rather than sprint 2, but this increase was not shown in the completion rate because the team assigned story points more than its capacity and didn't remove them before the sprint closure date → We havn't to assigne much stories regarding the team capacity, and if we do that and the team doesn't close i,t we have to remove it before the sprint closure date (SM - PO - TL)